Showing posts with label Earth. Show all posts
Showing posts with label Earth. Show all posts
Saturday, 1 May 2010

Saturday, 5 July 2008
Does the Sun look smaller to you?
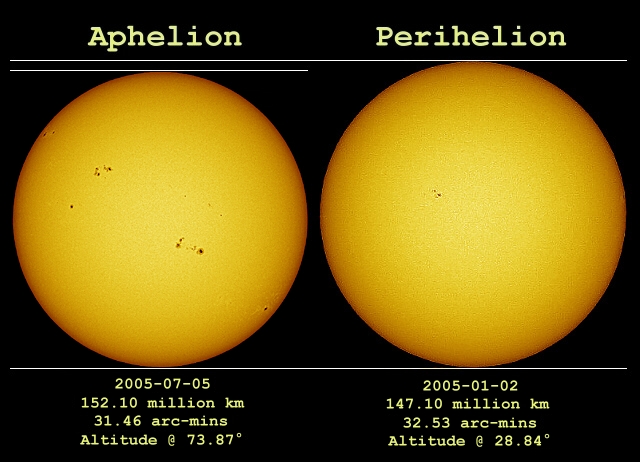 Criminy, I almost forgot: today, July 4th, at roughly 08:00 UT, the Earth was at aphelion.
Uh, what? I hear you ask. OK, brief astrolesson for ya, then back to the grill!
The Earth does not orbit the Sun in a perfect circle. The orbit is slightly elliptical. If you were to draw the Earth’s orbit on a piece of paper, you’d need a sharp eye to detect its non-circularity, but deviant it is. What this means in real terms is that the Earth ranges from about 148 to about 152 million kilometers from the Sun over the course of six months (which is how long it takes to get from one side of the orbit to the other, of course).
When the Earth is closest to the Sun it’s at perihelion, and when it’s farthest it’s called aphelion (I usually pronounce that app-helion, if you care, though I’ve heard others say aff-helion). So today we passed aphelion, and slowly but inexorably, over the next six months we’ll draw slightly closer to the Sun, and then the whole thing repeats.
That 4 million km difference sounds like a lot. But over the 150 million average radius of the orbit it’s only a slight difference by eye. The Sun will look about 3% larger at perihelion versus aphelion, and you’d never notice that, especially since the change is slow and takes six months. The amount of sunlight hitting the Earth does increase at perihelion, being about 5% greater than at aphelion. That’s quite a bit! But the effect isn’t as bad as you’d think. Why not?
For us northern hemisphere folks, we are farthest from the Sun in summer, and closest in winter, so that mitigates the temperature extreme. On average, winters are a bit warmer and summers a bit cooler. But wait! In the southern hemisphere, the seasons are reversed! So they should have extra hot summers and extra cold winters.
But they don’t. Why not? Because the southern hemisphere is mostly water. Go ahead, find a globe and take a look; it’s incredible how much of that half the Earth is water bound. Water absorbs and releases heat slowly, so all summer the oceans suck down that extra solar energy, and release it all winter. That helps balance out the temperature extremes.
Oh, one more thing: the Earth precesses, that is, the axis of rotation moves like a wobbling top. It takes a long time for the wobble to make one cycle, well over 20,000 years. But this changes the timing of the seasons compared to the orbit. In a few millennia, we’ll have perihelion at the same time as northern summer, and aphelion at northern winter. It’s hard to say what effect this will have on the environment, since it brings extra-hot summers and extra-cold winters. However, the last time this happened was around the same time the Sahara forest went away and was replaced by, well, guess.
But for today, don’t fret too much about wandering poles and aphelion… except to say, if you’re out sweltering in the Sun today celebrating the holiday in the U.S., you might want to take just a moment and be glad our orbit isn’t more elliptical, or that it isn’t 15,000 AD.
Saturday, 7 July 2007
Super-Kamiokande
 It is believed soon after the big bang, when the universe was at a very high temperature, many neutrinos were produced. In addition, when a star explodes as a supernova, many neutrinos are emitted. Neutrinos are also copiously produced in nuclear reactions in the core of the sun. Also cosmic rays which come into the earth's atmosphere and interact with oxygen or nitrogen nuclei produce neutrinos. Purposes of the research are to elucidate the source of energy of the sun and detect the properties of the enigmatic neutrinos by observing these neutrinos with considerable precision.The detector consists of an inner volume and an outer volume which contain 32,000 tons and 18,000 tons of pure water respectively. The outer detector is used to veto entering cosmic ray muons and is used as a buffer to keep radiation emitted by the surrounding rock and walls from entering the inner volume. The inner detector has 11,200 photomultiplier tubes (PMTs) attached to the bottom, top and sides facing inward. The PMTs collect the pale blue light called Cerenkov light which is emitted by particles travelling fast as light in the water. By measuring the direction and intensity of this light,information about particle interactions such as neutrino interactions or proton decay can be determined (Official Website).
Thursday, 5 April 2007
Worldmapper
 Worldmapper is a collection of world maps, where territories are re-sized on each map according to the subject of interest.
There are 366 maps, also available as PDF posters.
Wednesday, 3 January 2007
Hurricane Katrina simulation

Click on image to view movie.
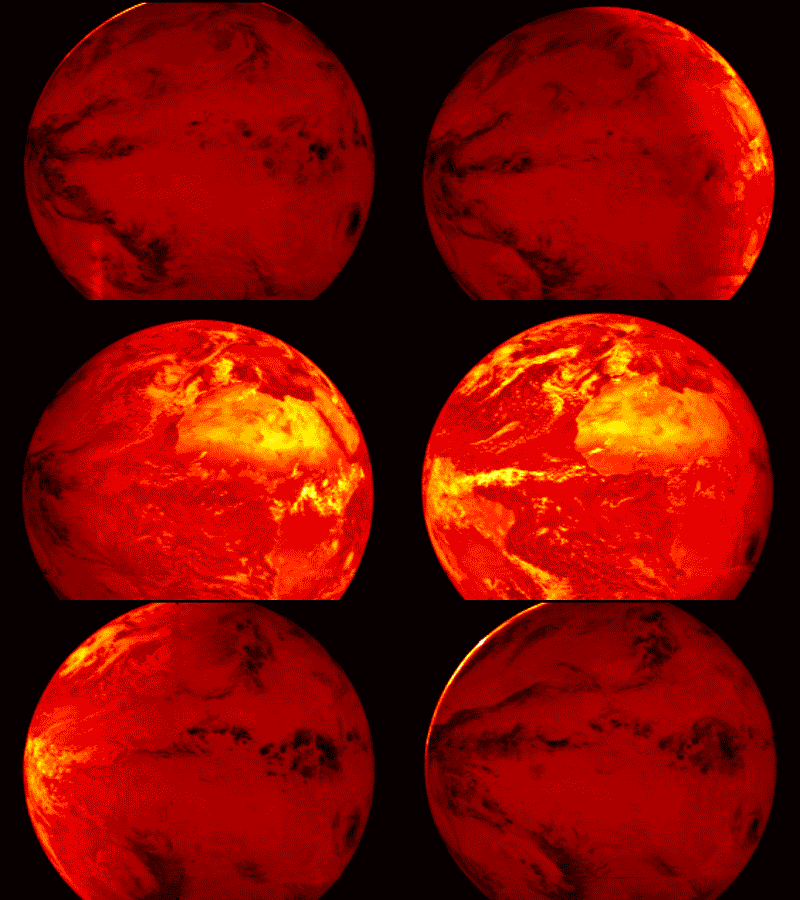
Orange represents ocean temperatures at 82 degrees Fahrenheit or higher. This is the temperature required for hurricanes to form. The bottom left window shows wind analysis model data from NASA's Modeling, Analysis, and Prediction (MAP '05) program. The top right window shows rainfall accumulation for Hurricane Katrina from the TRMM spacecraft. The bottom right window shows energy-releasing deep convective clouds (as high as 16 km) in the eyewall of Hurricane Katrina. These clouds, called hot towers, formed on August 28 while the storm was intensifying to a category 5 hurricane.
Monday, 25 December 2006
A pale blue dot
It was Carl Sagan's idea to turn Voyager's camera back toward the planet that launched the spacecraft in order to reveal to that planet's inhabitants their "true circumstance and condition". After much resistance, Dr. Sagan prevailed, and on February 14, 1990, from a distance of 6.4 billion kilometers , Voyager 1 captured this image of our Earth. Here the entire world fills only 0.12 pixel and appears as a tiny crescent of light.

Look again at that dot. That's here. That's home. That's us. On it everyone you love, everyone you know, everyone you ever heard of, every human being who ever was, lived out their lives. The aggregate or your joy and suffering, thousands of confident religions, ideologies and economic doctrines, every hunter and forager, every hero and coward, every creator and distroyer of civilization, every king and peasant, every young couple in love, every mother and father, hopeful child, inventor and explorer, every teacher of morals, every corrupt politician, every "superstar", every "supreme leader", every saint and sinner, in the history of our species lived here -on a mote of dust suspended in a sunbeam.
The earth is a very small stage in a vast cosmic arena. Think of the rivers of blood spilled by all those generals and emperors so that, in glory and triumph, they could become the momentary masters of a fraction of a dot. Think of the endless cruelties visited by the inhabitants of a corner of this pixel on the scarcely distinguishable inhabitants of some other corner, how frequent their misunderstandings, how eager they are to kill one another, how fervent their hatreds.
Our posturing, our imagined self-importance, the delusion that we have some privileged position in the Universe, are challenged by this point of pale light. Our planet is a lonely speck in the great enveloping cosmic dark. In our obscurity, in all this vastness, there is no hint that help will come from elsewhere to save us from ourselves.
The Earth is the only world known so far to harbor life. There is nowhere else, at least in the near future, to which our species could migrate. Visit, yes. Settle, not yet. Like it or not, for the moment the Earth is where we make our stand.
It has been said that astronomy is a humbling and character-building experience. There is perhaps no better demonstration of the folly of human conceits that this distant image or our tiny world. To me, it underscores our responsability to deal more kindly with one another , and to preserve and cherish the pale blue dot , the only home we've ever known.
Carl Sagan, Pale Blue Dot, Random House, 1994
Look again at that dot. That's here. That's home. That's us. On it everyone you love, everyone you know, everyone you ever heard of, every human being who ever was, lived out their lives. The aggregate or your joy and suffering, thousands of confident religions, ideologies and economic doctrines, every hunter and forager, every hero and coward, every creator and distroyer of civilization, every king and peasant, every young couple in love, every mother and father, hopeful child, inventor and explorer, every teacher of morals, every corrupt politician, every "superstar", every "supreme leader", every saint and sinner, in the history of our species lived here -on a mote of dust suspended in a sunbeam.
The earth is a very small stage in a vast cosmic arena. Think of the rivers of blood spilled by all those generals and emperors so that, in glory and triumph, they could become the momentary masters of a fraction of a dot. Think of the endless cruelties visited by the inhabitants of a corner of this pixel on the scarcely distinguishable inhabitants of some other corner, how frequent their misunderstandings, how eager they are to kill one another, how fervent their hatreds.
Our posturing, our imagined self-importance, the delusion that we have some privileged position in the Universe, are challenged by this point of pale light. Our planet is a lonely speck in the great enveloping cosmic dark. In our obscurity, in all this vastness, there is no hint that help will come from elsewhere to save us from ourselves.
The Earth is the only world known so far to harbor life. There is nowhere else, at least in the near future, to which our species could migrate. Visit, yes. Settle, not yet. Like it or not, for the moment the Earth is where we make our stand.
It has been said that astronomy is a humbling and character-building experience. There is perhaps no better demonstration of the folly of human conceits that this distant image or our tiny world. To me, it underscores our responsability to deal more kindly with one another , and to preserve and cherish the pale blue dot , the only home we've ever known.
Carl Sagan, Pale Blue Dot, Random House, 1994
Sunday, 24 December 2006
Earth from Space

pdf documents showing beautiful photos from Africa, Asia and Oceania from Space.
Earth from Space - Africa
Earth from Space - Asia and Oceania
Madagascar
Ships passing through the Panama Canal
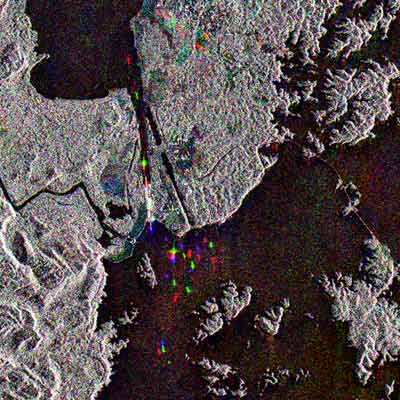 Appearing in this Envisat radar image like shining jewels, ships pass from the man-made Lake Gatun through the Panama Canal across Central America.
The colour in this image is due to it being a multitemporal composite, made up of three Advanced Synthetic Aperture Radar (ASAR) images acquired on different dates, with separate colours assigned to each acquisition to highlight differences between them: Red for 16 March, Green for 12 Jan and blue for 14 October 2004. The view was acquired in ASAR Image Mode Precision, with pixel sampling of 12.5 metres.
Satellite portrait of global plant growth will aid climate research
An ambitious ESA (European Space Agency) project to chart ten years in the life of the Earth's vegetation has reached a midway point, with participants and end-users having met to review progress so far. Harnessing many terabytes of satellite data, the GLOBCARBON project is intended to hone the accuracy of climate change forecasting. GLOBCARBON involves the development of a service to generate fully calibrated estimates of land products based on a variety of Earth Observation data, suitable for assimilation into sophisticated software simulations of the planet created by the global carbon modelling community.
The service is focused on the generation of various global estimates of aspects of terrestrial vegetation: the number, location and area of fire-affected land, known as Burnt Area Estimates (BAE), the area of green leaf exposed to incoming sunlight for photosynthesis, known as Leaf Area Index (LAI), the sunlight actually absorbed for photosynthesis, known as the Fraction of Absorbed Photosynthetically Active Radiation (fAPAR) and the Vegetation Growth Cycle (VGC).
The service is focused on the generation of various global estimates of aspects of terrestrial vegetation: the number, location and area of fire-affected land, known as Burnt Area Estimates (BAE), the area of green leaf exposed to incoming sunlight for photosynthesis, known as Leaf Area Index (LAI), the sunlight actually absorbed for photosynthesis, known as the Fraction of Absorbed Photosynthetically Active Radiation (fAPAR) and the Vegetation Growth Cycle (VGC).
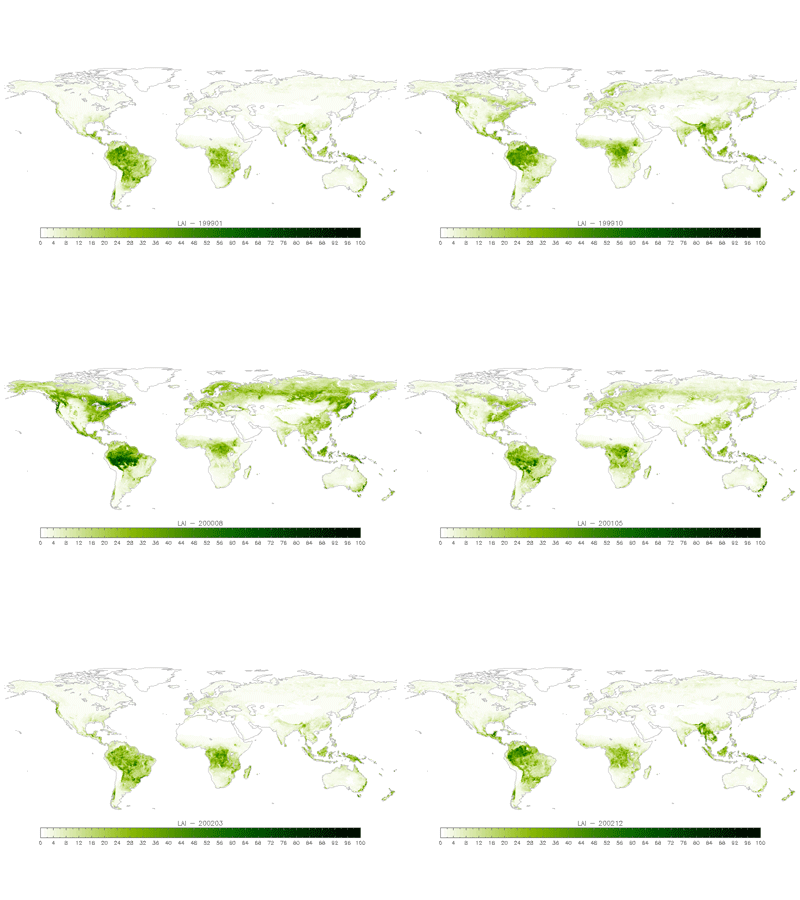
Worldwide leaf area index (LAI)


Explore planet Earth in near-real time

Have you ever wanted to track natural events in progress, such as fires, floods and volcanic eruptions, or simply explore the planet through the eyes of a satellite? ESA has created a website, MIRAVI, which gives access to the most recently acquired images from the world’s largest Earth Observation satellite, Envisat. MIRAVI, short for MERIS Images RApid VIsualisation, tracks Envisat around the globe, generates images from the raw data collected by Envisat’s optical instrument, MERIS, and provides them online within two hours. MIRAVI is free and requires no registration (Go).
Saturday, 23 December 2006
World Wind
 World Wind lets you zoom from satellite altitude into any place on Earth. Leveraging Landsat satellite imagery and Shuttle Radar Topography Mission data, World Wind lets you experience Earth terrain in visually rich 3D, just as if you were really there.Virtually visit any place in the world. Look across the Andes, into the Grand Canyon, over the Alps, or along the African Sahara (download).
Tuesday, 19 December 2006
Earth from above

The "Earth from above Project" makes possible to draw up a true portrait of our planet which unceasingly continues to be updated. The web invites each one to reflect on engagement in favour of the sustainable development. The legends hich accompany the images inform the reader of the exposures the Earth seen on the sky of the alarming ecological evolutions (Visit the Menu and search by country).
Subscribe to:
Posts (Atom)